market Snapshot – March 2023
Apr. 10, 23 | Market Updates

Goodbye winter, hello spring!
Traditionally, this is the time when not only do we start to feel some warmer weather but we also begin to see the real estate market heat up too. Before we get into the housing market let me bring you up to speed a little on the economy which helps give context to the spending habits of buyers and sellers today.
At the beginning of March the Bank of Canada (BoC) decided to hold its target for the overnight rate at 4.5%, with the Bank Rate at 4.75% and deposit rate at 4.5%. We saw inflation ease to 5.9% in January to 5.2% in February, which is one small step closer to the foal of 2% by the end of 2023. What is also interesting to note was just at the end of March details of the 2023 federal budget were unveiled. The intention of the budget is to strengthen the middle class, support an affordable economy and generate a healthy future without heightening inflation. Another noteworthy observation was that the budget did not propose any increases in personal or business tax rates. I say all this to help give some context when we drill down in the housing sector of our economy, and specifically what’s happening here in Cambridge, Ontario.
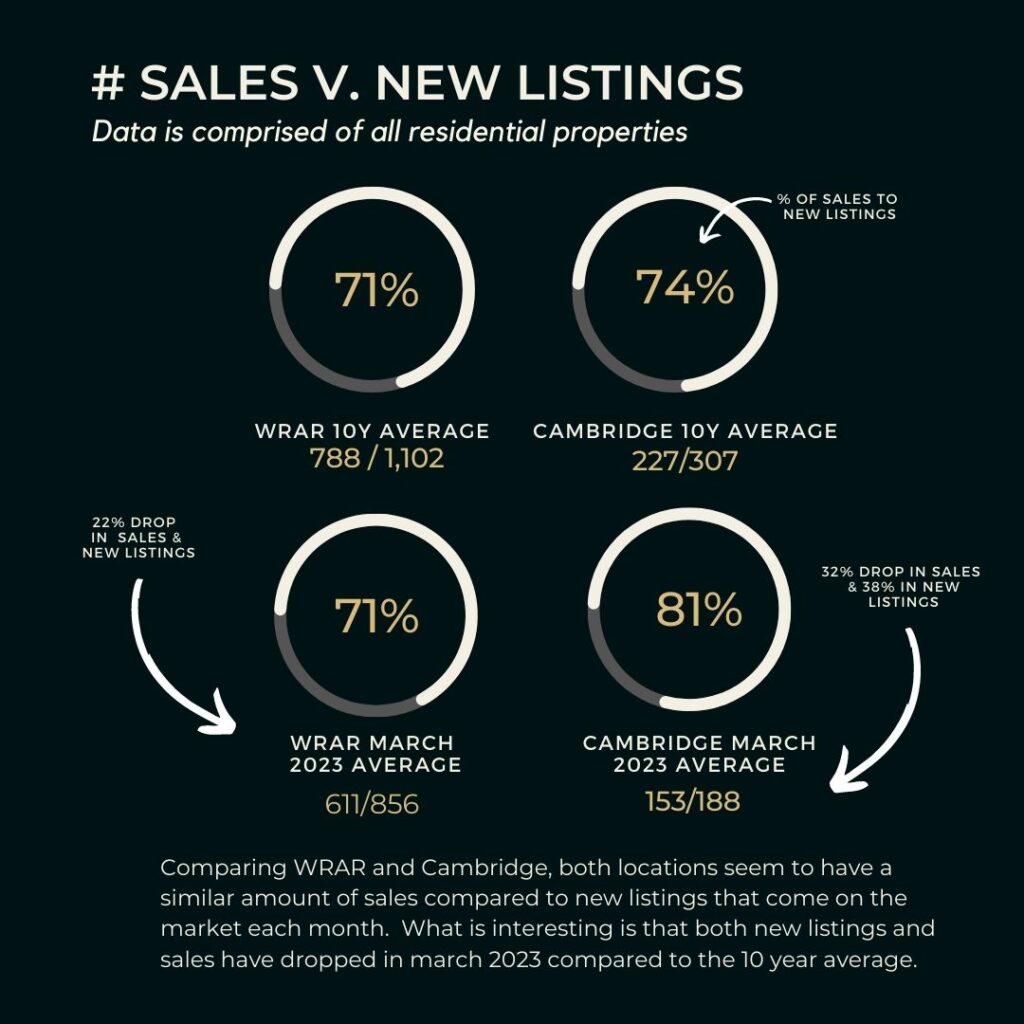
Sales volume in Cambridge through the Multiple Listing Service® (MLS®) System of the Waterloo Region Association of REALTORS® (WRAR) continues to remain low. In March for all of Waterloo Region there were 611 homes sold in March, representing a decrease of 38.4 per cent compared to March 2022 and 33.6 per cent below the previous 5-year average for the month.
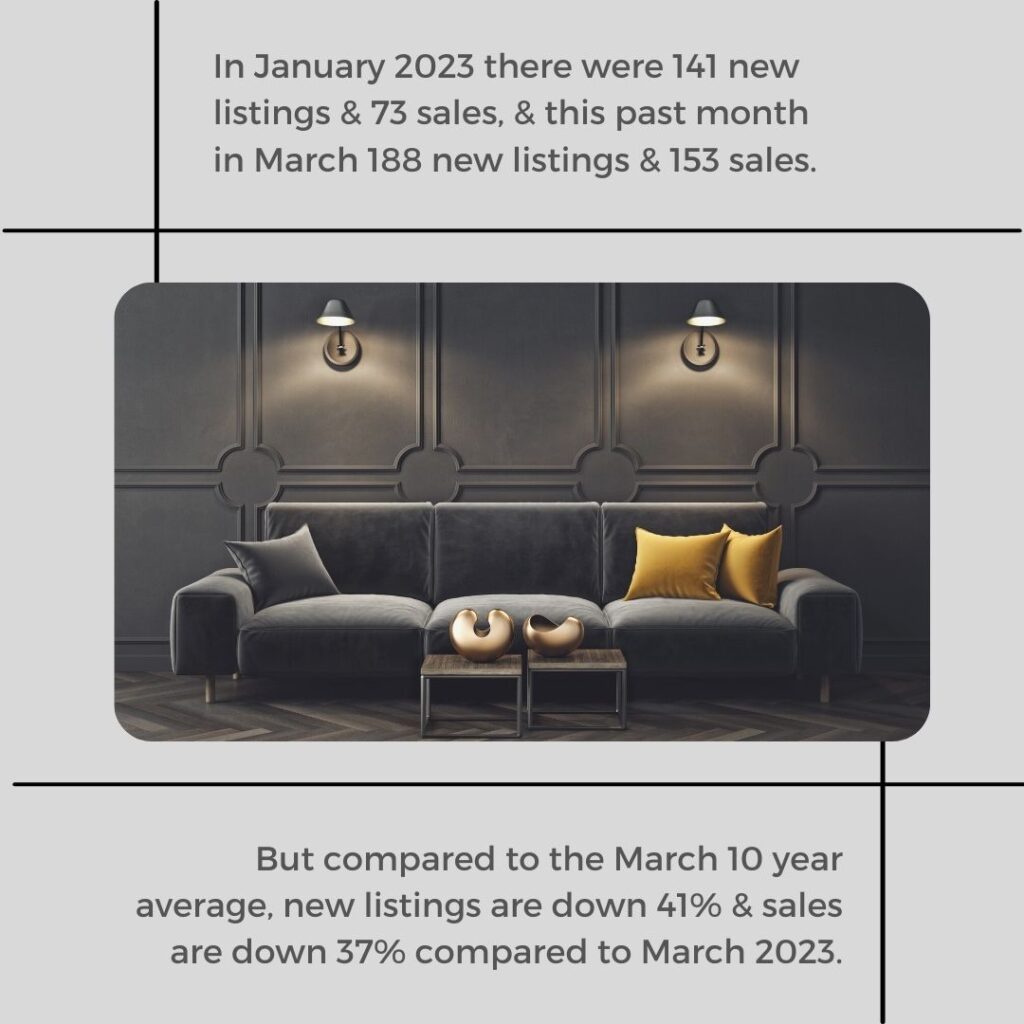
Looking closer to home, in Cambridge there were 188 new listings and 153 listings sold. We are looking at just one months supply of inventory. In fact, what we are seeing is demand exceeding inventory, currently a deficit in homes compared to buyers. The drop in inventory becomes staggeringly apparent when we look at the ten year average and begin to see that historically new listings for residential properties in Cambridge are around 300 in March but are now almost half that. Number of sales is also proportional, with the ten year average being around 227 and now 153.
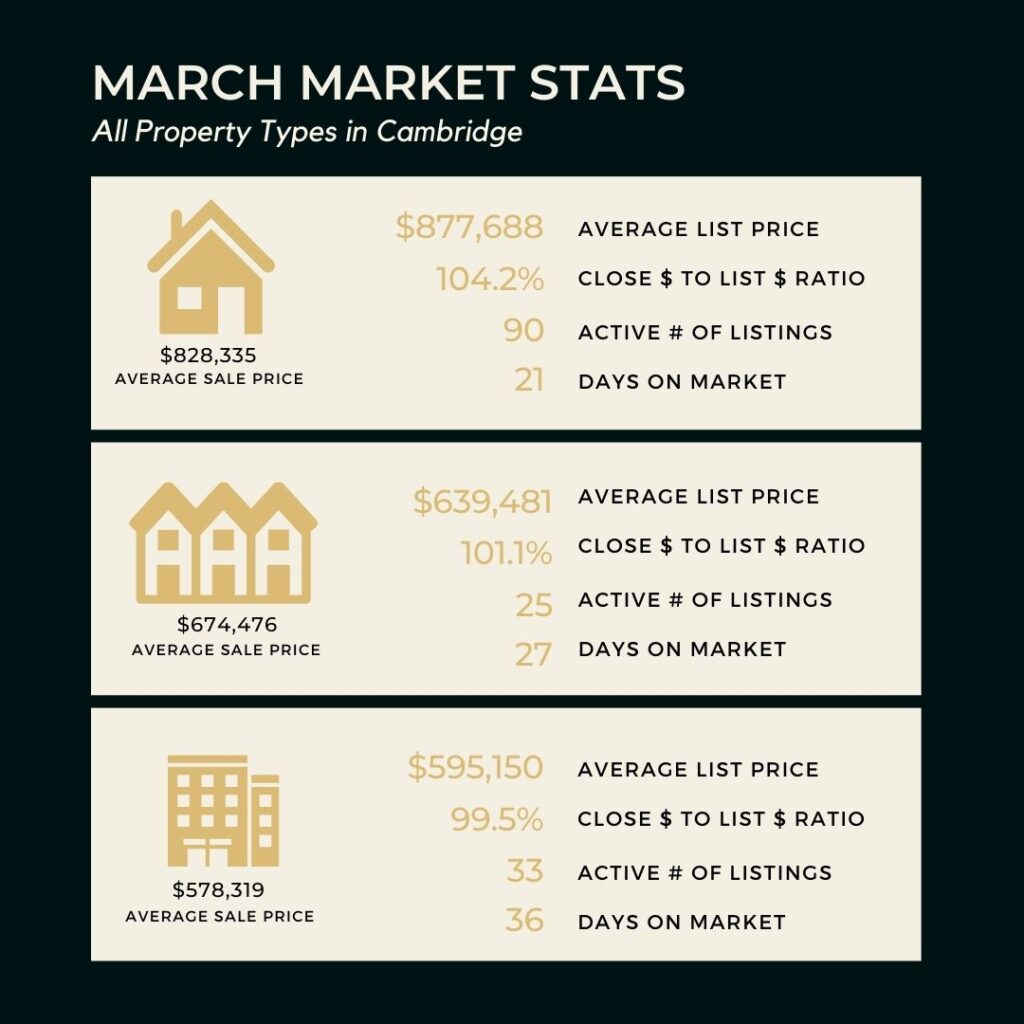
There continues to be relatively consistent average sale prices for properties in Cambridge. For all property types in Cambridge the average list price is $775,613 and average sale price being $733,236. That means that on average in March we are seeing a 5% difference in average list price to sale price.
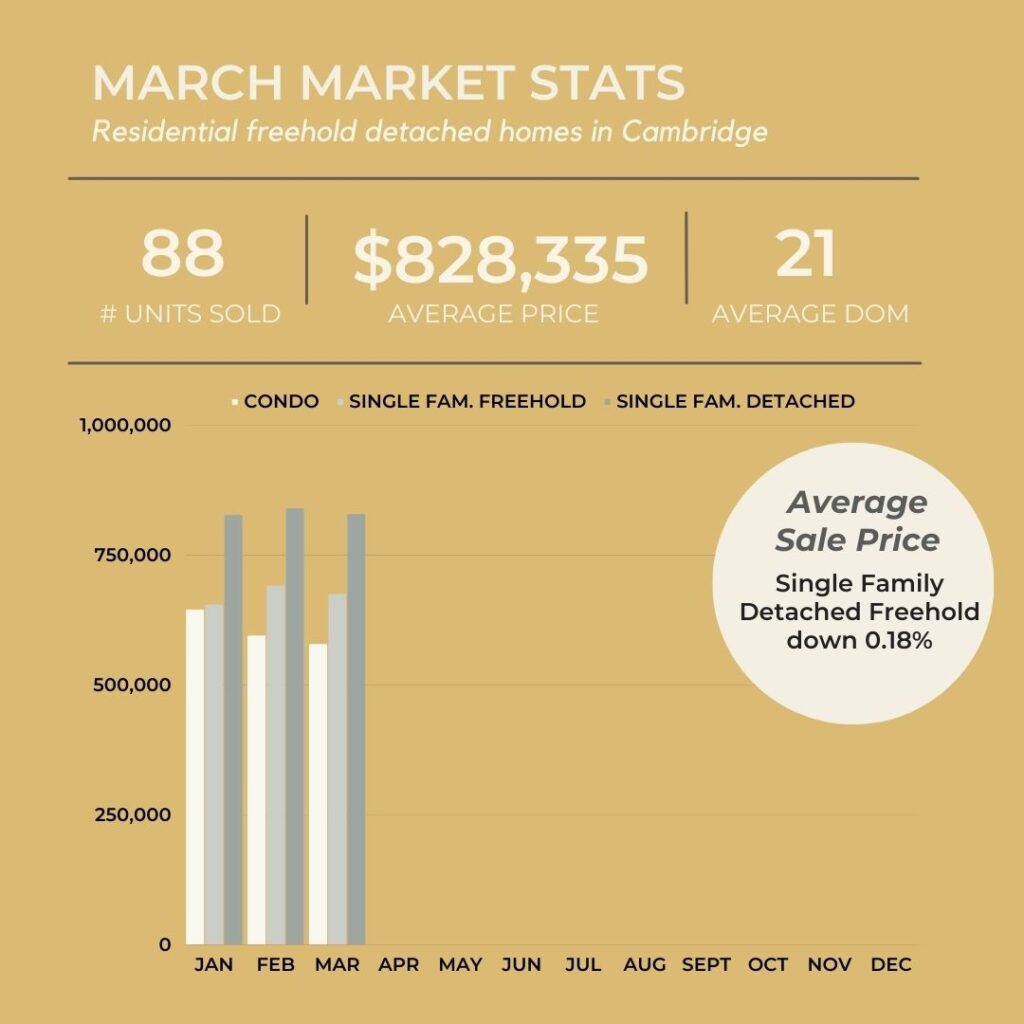
If we look a little closer at the specific property types, a single family detached home in March was listed on average at $877,688 and sold 5% less then asking. If you are wondering the difference in price between a single family detached home and attached home (semi or townhouse), there is an 18% difference in the average sale price. A single family attached property sold on average for $674,476 in March here in Cambridge. And, condos in Cambridge sold on average for 16% less then an attached home, $578,319, but remember these properties even though the sale sticker is lower, your monthly expenses can work out to be roughly the same as attached freehold, since there are condo fees to account for.
If you want to discuss what’s happening in the market, or maybe the process of buying or selling, I am always ready to have that conversation. All you have to do, is reach out by filling out the form below and we can chat more over coffee. And be sure to follow me on Facebook or Instagram for all the behind the scene and up to the minute news.

![]()